|
|
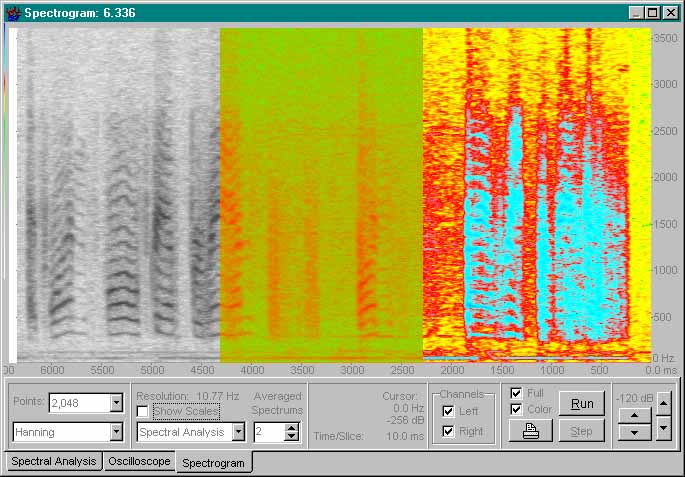
Displayed is a Spectrogram of Neil Armstrongs most famous speech.
The basic controls for the Spectrogram are the same as with the Spectral Analysis page,
(see Spectral Analysis Display for more info).
- The file has been run through performing a 2048 point FFT every 10 milliseconds,
(this Time/Slice can be adjusted between 1 - 100 milliseconds) - Minimal smoothing has been applied with 2 averages
- All three color modes have been used
On a Pentium 120 MHz, a 1024 point FFT plus all the Spectrogram drawing of a size (650 x 335) can be performed approximately every 25 milliseconds.
An excellent introduction to Spectrogram reading can be found at the CSLU
Audio Suite